- Research
- Open access
- Published:
(Re-)Designing a measure of student’s attitudes toward science: a longitudinal psychometric approach
International Journal of STEM Education volume 9, Article number: 12 (2022)
Abstract
Background
Capturing measures of students’ attitudes toward science has long been a focus within the field of science education. The resulting interest has led to the development of many instruments over the years. There is considerable disagreement about how attitudes should be measured, and especially whether students’ attitudes toward science can or should be measured unidimensionally, or whether separate attitude dimensions or subscales should be considered. When it is agreed upon that the attitudes toward science construct should be measured along separate subscales, there is no consensus about which subscales should be used.
Methods
A streamlined version of the modified Attitudes Towards Science Inventory (mATSI), a widely used science measurement instrument, was validated for a more diverse sample as compared to the original study (Weinburgh and Steele in Journal of Women and Minorities in Science and Engineering 6:87–94, 2000). The analytical approach used factor analyses and longitudinal measurement invariance. The study used a sample of 2016 self-reported responses from 6 and 7th grade students. The factor analysis elucidated the factor structure of students’ attitudes toward science, and some modifications were made in accordance with the results. Measurement invariance analysis was used to confirm the stability of the measure.
Results
Our results support that the subscales, anxiety toward science and value and enjoyment of science, are two factors and stable over time.
Conclusions
Our results suggest that our proposed modified factor structure for students’ attitudes toward science is reliable, valid, and appropriate for use in longitudinal studies. This study and its resulting streamlined mATSI survey could be of value to those interested in studying student engagement and measuring middle-school students' attitudes toward science.
Introduction
In the United States, increasing the numbers of students entering careers in the fields of science, technology, engineering, and mathematics (STEM) has been a priority. Yet, despite these efforts and against the projections of economists which indicate that STEM job opportunities are expected to increase more quickly than the combined average of other fields in the coming years (Lacey & Wright, 2009; Wang, 2013), there is a decline in students entering STEM fields (Lewin & Zhong, 2013). Science education researchers have demonstrated the connection between interest in science careers during K-12 educational experiences and eventual participation in science careers (Maltese & Tai, 2011; Sadler et al., 2012; Tai et al., 2006). Desire to pursue a STEM career or STEM coursework is considered to be closely linked to attitudes about science (Potvin & Hasni, 2014), and in fact many attitudes toward science instruments have included a STEM career component (Kind et al., 2007; Romine et al., 2014; Unfried et al., 2015). Apart from these workforce development-focused concerns is the potential threat to the growth and promotion of scientific literacy that declining interest and declining positive attitudes toward science may threaten the promotion of scientific literacy (Osborne et al., 2003), and lead to negative ramifications for both individual citizens and society as a whole. As a result, identifying an instrument with the potential to be used for longitudinal analysis is crucial. The aim of this study is to offer such an instrument with analysis to support both its shortened format to allow for more efficient data collection and its viability as a longitudinal measurement instrument.
Student attitudes towards science have been a focal area of research in science education for decades (Buck et al., 2009; Haladyna & Shaughnessy, 1982; Lamb et al., 2012; Osborne et al., 2003; Rennie & Punch, 1991; Romine et al., 2014; Shirgley, 1990; Simpson & Oliver, 1990; Unfried et al., 2015), (Schibeci, 1984). The relationship of student attitudes toward science with factors such as gender, science class instructional strategies, and age has been well-studied (Catsambis, 1995; Pell & Jarvis, 2001; Sorge, 2007). Age or grade level in particular has exacted notice, as there is concern about the documented decline of attitudes toward science as students increase in age and progress through school (Osborne et al., 2003), a trend that is especially pronounced among girls and young women (Barmby et al., 2008). This phenomenon, along with existing underrepresentation of women in many STEM fields, highlights the need for more longitudinal studies to investigate this trend.
Defining students attitudes toward science
The defining of student attitudes toward science, as well as how to best measure it, has been a major topic of study (Osborne et al., 2003; Potvin & Hasni, 2014). Koballa (1988) emphasized that attitudes are different from beliefs and values, are relatively enduring, are learned, and related to behavior as they reflect feelings towards a specific object. Attitudes in general are most commonly viewed as having three distinct components—a cognitive component (a person’s beliefs about an object), a conative component (a person’s intent to act on an object in a certain way), and finally an affective component (a person’s feeling about an object). In (Gardner, 1975), clarified the difference between ‘attitudes towards science’, which fall within the affective domain, and ‘scientific attitudes’ which are cognitive in nature (Osborne et al., 2003). Attitudes toward science include the “feelings, beliefs and values held about an object that may be the enterprise of science, school science, and the impact of science on society or scientists themselves” (Osborne et al., 2003). Scientific attitudes on the other hand relate more to scientific habits of mind, or scientific thinking (Osborne et al., 2003). This study focuses only on attitudes toward science. A focus on the affective component of attitudes, referred to as attitudes toward science, is common in the field of science education, and in line with previous studies (Koballa, 1988; Potvin & Hasni, 2014).
Identifying aspects of attitudes toward science
Developing instruments that reliably capture the construct of attitude toward science has proved particularly challenging for many reasons (Lamb et al., 2012; Osborne et al., 2003; Unfried et al., 2015; Weinburgh & Steele, 2000). One reason is that there is a long-standing question about whether attitudes toward science can be measured as a single construct, or whether there are distinct sub-components within attitudes towards science that should be measured separately, and if so, which sub-components should be measured separately (Gardner, 1974, 1995; Osborne et al., 2003). This uncertainty is not surprising since, if the affective component of attitudes is considered as the beliefs a person has about an object, then we would expect those beliefs to vary based on the object we are considering, and how narrowly we subdivide aspects of that object (Kind et al., 2007). For instance, one can consider attitudes toward school science as one construct, or consider subcomponents of school science such as attitudes toward the science teacher, classroom, and/or content (Kind et al., 2007). Due to this distinction, it is not surprising that many underlying subscales of student attitudes toward science have been identified. As a result, many different instruments have been developed and modified, some of which place emphasis on different aspects of student attitudes toward science (Osborne et al., 2003). Thus, although considerable work has been carried out to validate or modify existing and commonly used instruments such as the Test of Science Related Attitudes (TOSRA; Fraser, 1978; Potvin & Hasni, 2014; Villafañe & Lewis, 2016) and the modified Attitudes toward Science Inventory (mATSI; Osborne et al., 2003; Weinburgh & Steele, 2000); as well as create new instruments (Unfried et al., 2015), questions remain about the definition of subcomponents.
For instance, Kind et al. (2007) focused on the development of attitude toward science measures, and identified six a priori separate attitudes to science measures (learning science in school, self-concept in science, practical work in science, science outside of school, future participation in science, and importance of science). While their work confirms the unidimensionality of these six “attitudes”, they also found that three of these measures (learning science in school, science outside of school, and future participation in science) loaded onto a single more general “attitude toward science” construct, based on a further analysis. This result raised questions regarding the attitude toward science construct and subscales. It is clear, however, that any identified constructs of student attitude toward science must be considered unidimensional, or in other words, measure the same thing (Lumsden, 1961).
With the existence of many attitudes toward science scales with different subscale components, it is still unclear whether researchers are measuring the same aspects of student attitudes towards science, which complicates comparisons between studies (Barmby et al., 2008; Osborne et al., 2003). This uncertainty makes it even more important that when developing “student attitudes toward science” instruments researchers not only pay close attention to the alignment between the items used to measure constructs, and the objects (i.e., school science curriculum or school science teacher) of particular attitudes being measured, but also to the unidimensionality of the proposed attitudinal constructs and by extension the construct, convergent, and discriminant validity of the measured subscales. As the identification of subscales of attitudes toward science can be expected to vary based on the object and specificity identified, we do not challenge the identification and use of various subscales, but rather note that additional quantitative techniques should be used when considering attitude toward science instruments and subscales.
Establishing unidimensionality and invariance
One technique that can be used, along with conceptual consideration of items used to measure attitude toward science constructs, is factor analysis, which can be used to explore the unidimensionality of underlying constructs (Lumsden, 1961). Quantitative indicators of unidimensionality provide support that a cluster of items are reliably measuring a true construct. Thus, this type of evidence is important to establish what subscales, if any, should be included in a measure of attitudes toward science. Attitude toward science constructs, both overall and subscales, should ideally have theoretical and quantitative evidence of unidimensionality. This is especially relevant to the study of attitudes toward science given the variety of existing attitude toward science instruments and subscales. Osborne et al. (2003) and Kind et al. (2007) suggest that researchers should utilize factor analysis in addition to internal consistency measures such as Cronbach’s α. The unidimensionality of measured attitude toward science subscales is not an object that the internal consistency confirms, but is an assumption of computing the internal consistency. The Kind et al. (2007) study described above is an example of how factor analysis can be used to clarify subscales based on the underlying factor structure of attitude toward science instruments. If only internal consistency measures are employed and unidimensionality is not confirmed, there is a possibility that although items are highly correlated they do not measure a conceptually similar and meaningful construct (Osborne et al., 2003). Thus, we argue that it is important to begin not only with attitude toward science constructs shaped by considerations of conceptual meaning, theory, and previous studies; but also to confirm the dimensionality of identified constructs through the use of factor analysis.
Factor analysis should also be employed to verify validity of instruments when used in new studies with a unique sample of participants (Kind et al., 2007; Munby, 1997), especially considering that many instruments were validated using samples composed predominantly of white high school students (Weinburgh & Steele, 2000), and instruments have been shown to behave differently based on some background characteristics such as race/ethnicity (Villafañe & Lewis, 2016; Weinburgh & Steele, 2000). Thus, additional measurement invariance analyses are also necessary to determine whether identified constructs perform in the same way for subgroups of students based on background characteristics such as race/ethnicity, gender, socioeconomic status, and age/grade level. If a study utilizes longitudinal data, longitudinal invariance should also be established (Khoo et al., 2006; Meredith & Horn, 2001; Millsap & Cham, 2012). Additional longitudinal studies will help to elucidate how student attitudes toward science change over time and are a particular focus of science education researchers (Osborne et al., 2003) and policymakers given the implications for overall science engagement and eventual career participation.
Modification of mATSI
An instrument of particular interest is the modified Attitudes Toward Science Inventory (mATSI) instrument. The mATSI is a shortened and modified version of the original Attitudes Toward Science Inventory (ATSI) developed by Goglin and Swartz (1992). While the original ATSI instrument sampled college students, the mATSI was developed for elementary school children. The mATSI instrument has been a mainstay of student science attitude research since its introduction in 2000 due to its modest length and well-established validity and reliability (Weinburgh & Steele, 2000). Since 2000, it has been used in a variety of research studies (e.g., Akrsu & Kariper, 2013; Buck et al., 2009, 2014; Cartwright, & Atwood, 2014; Hussar et al., 2008; Junious, 2016; Weinburgh, 2003). This instrument includes five attitudes sub-scales: (1) perception of the teacher; (2) anxiety toward science; (3) value of science to society; (4) self-confidence in science, and (5) the desire to do science (Weinburgh & Steele, 2000).
Researchers should confirm the validity of a particular instrument for the unique sample of students before embarking on new analyses (Kind et al., 2007). With these considerations and concerns in mind, Weinburgh and Steele (2000) examined the reliability of the existing instrument (which was previously explored using a sample of predominantly White students) with a participant pool of 1,381 fifth grade students with a higher representation of African American students (n = 658) compared to White students (n = 723) when developing the mATSI. Thus, they were able to confirm that the instrument was appropriate for measuring the attitudes toward science of younger students and African American students by confirming internal consistency (Cronbach’s alpha) levels above 0.50 for Black students, White students, male students, and female students. The authors also shortened the original instrument to make administration of the survey less time consuming, and more appropriate for younger students.
With the aforementioned considerations for the generation of reliable and valid attitudes toward science instruments in mind, we aimed to extend the work of previous researchers and modify and shorten an existing instrument, the mATSI, to be used to measure aspects of attitudes toward science in a large, racially/ethnically diverse, longitudinal sample. The mATSI was chosen based on: (a) its suitability for younger children; (b) its previously established validity for reliability across gender and racial/ethnic groups; (c) its modest length of 25 items reduced from a previous version of 48 items, and (d) its broad use in science education research. In our study, elementary and middle-school students were surveyed, so the suitability for younger students was important, as well as the short length, as the mATSI items were included along with other survey items. We note the importance of and employ the following techniques; re-examining the reliability and validity of instruments with unique samples of students and across demographic subgroups of interest, using factor analysis to critically examine attitude toward science subscales, and finally establishing longitudinal measurement invariance of the instrument for future use in longitudinal studies. The modification of the mATSI using these techniques improves upon a well-established instrument through the confirmation of reliability, validity, and measurement invariance across gender and racial/ethnic groups as well as over time. This establishes that the instrument is still valid among a more recently sampled population, as well as demonstrating that it can be used reliably in longitudinal studies. Furthermore, the instrument is further reduced making it convenient for combined use with other instruments, which allows researchers to expand the scope of their inquiry.
The mATSI was administered as part of a larger longitudinal survey to a sample representing multiple schools and school districts and racial/ethnic groups. Due to the differences of this sample as compared to the sample that Weinburgh and Steele used when validating the mATSI survey, the five identified “attitude toward science” constructs were re-examined using both theory and factor analysis. In this analysis, the analysis focused on the mATSI response data from 2016 students in 6th (n = 996; 49.4%) and 7th grades (n = 1020; 50.6%) over four semesters starting in the Fall 2012 semester. In this longitudinal study, measures were repeated over three additional semesters spanning a total of two successive academic years. The analytical approach applied in this study divided the whole sample into two randomly selected half samples, one half to be used with the exploratory factor analysis as a “training sample” and the second half (referred to as the “holdout” data) to be used with a confirmatory factor analysis. An exploratory factor analysis (EFA) was employed to determine how many underlying factors emerge from the mATSI items, because the items may not be aware of the scale for which they have been written (Bandalos & Finney, 2010). In this EFA, the conceptual alignment of the items with the factors based on the number of emergent factors, correlational values, and factor loading scores were considered. Utilizing cross-validation, confirmatory factor analysis (CFA) was applied to confirm the model fit within a half holdout sample. It is important to note that the performance of mATSI items were examined carefully in this particular sample, which is more racially/ethnically diverse and includes a wider age range as compared to the Weinburgh and Steele (2000) sample. Finally, the stability of the factor structure trimmed via EFA and CFA over four semesters by conducting longitudinal measurement invariance tests was confirmed. Overall, this study aimed to (1) examine the dimensionality of the five attitudes toward science constructs identified for the mATSI instrument in regards to our particular sample of students using factor analysis and existing theory; (2) measure the factor reliability estimates of the constructs identified, and (3) investigate whether the identified constructs can be measured consistently over time periods using longitudinal measurement invariance analysis.
Methods
Participants
Data used in this study were obtained from a survey administered over four time points for 2 years, asking for students’ opinions about many statements regarding their preferences for learning activities and attitudes toward science learning. The 2016 survey responses from 6th graders (n = 996) and 7th graders (n = 1,020) were considered in totality in this study. The survey was administered at four different time points: Fall 2012, Spring 2013, Fall 2013, and Spring 2014. The Fall 2012 sample contained roughly equal percentages of participants identifying as male and female (52.6% male; 47.4% female). Participants self-reported their racial/ethnic identity in Fall 2012 as: 48.9% White, 14.2% African American, 18.2% Hispanic, 2.3% Asian, and 16.3%, with multiple racial/ethnic identities (Table 1). Less than 1% participants reported themselves to be American Indians. There were similar demographics between 6 and 7th grade participants (Table 1). These values do not include unreported responses, which comprised 24.1% of the sample.
Measures
In Weinburgh and Steele’s paper, the researchers shortened the 48-item Attitudes Toward Science Inventory: Version A (ATSI:a) to 25 items in the modified Attitudes Towards Science Inventory which included five constructs (perception of the teacher, anxiety toward science, value of science to society, science self-efficacy or self-confidence, and the desire or aspiration to do science; Table 2). The administration time fell to about 40 min. Given the current time stresses related to school research, the 25 items instrument still proved to be too lengthy. Our own analysis also found that some items were redundant. To measure student attitudes toward science, we reduced the mATSI from 25 to 17 items (Table 2). These additional eight items were not found to significantly enhance the reliability of the measures, while eliminating them significantly cut back the time required to complete the questionnaire. The survey instrument used to collect the data set used in this study was developed through a pilot study. The data collected from this pilot study identified the weakest survey items within each of the five mATSI item categories. Specifically, the items with the lowest item-total correlation with the other items in the construct group were eliminated. When a single item was found to be significantly weaker than other items, it alone was removed. When several items were found to be similarly weak, these two or three survey items were eliminated. Careful attention was paid to maintain the integrity of each of the five categories. Thus, Weinburgh and Steele (2000)’s theoretical structure was retained in the shortened instrument. As with all prior research, the 17 items in the reduced instrument were scored on a 5-point Likert scale, ranging from 1 (Strongly disagree), 2 (Disagree), 3 (Neutral), 4 (Agree), and 5 (Strongly agree). Items eliminated from the mATSI are listed in Table 2 and descriptive statistics from the first sampling wave (Fall 2012) are provided in Table 3. This new 17-item version cut administration time back even further to 25 min. This administration time includes all survey activities such as passing out, collecting, and introducing the survey. For clarity, the 17-item version of the mATSI is referred to as the mATSI:1.
Exploratory factor analysis
To examine factor structures on attitude toward science measure of 17 items (mATSI:1), we randomly split our data into two separate datasets (the first one served as a training sample for exploratory factor analysis and the second was utilized as a holdout sample for confirmatory factor analysis) at each measurement point. This cross-validation procedure validates factor structure found in EFA for generalizability (Lattin et al., 2003). First, three statistical indicators were examined: multivariate normality with kurtosis and skewness, multivariate outlier with Cook’s distance, and multicollinearity with variance inflation factors (VIFs). As summarized in Table 3 for the first sampling wave, kurtosis and skewness values ranged between − 2 and 2 with the exception of one item that was within normal range at the other time points, and thus was not considered problematic. All of VIFs were less than 5, which indicates multivariate normality without multicollinearity violations. In addition, all of Cook’s distances were less than 0.14, which is smaller than a criterion of 1.00 and indicates there are no multivariate outliers in the dataset. Similarly, no evidence of a violation of multivariate normality, evidence of multivariate outliers, or multicollinearity at the other three time points was found.
Analyzing the sources of variance with least square-type solution and applying a likelihood ratio test with maximum likelihood (ML) estimates, potential factor structures were explored, ranging from one-factor model to seven-factor model (Bandalos & Finney, 2010). Because there are four time points, the best-fitting factor model across the four time points were selected. To enumerate the number of factors, Kaiser’s rule and parallel analysis (Horn, 1965; Humphreys & Montanelli, 1975) were applied for the least square-type approach (factor whose eigenvalues > 1.0). In EFA, the number of items was reduced due to redundancy as well as correlation values across factors that were either too high or too low. The procedure of finding a factor structure across four time points and revising items was iteratively applied until the best-fitting and stable EFA model was discovered.
Confirmatory factor analysis
After identifying the best-fitting factor structure based on the EFA, the factor structure was further examined using confirmatory factor analysis (CFA) with the remaining half of the data from the original sample (the “holdout” data) at each time point. In the EFA step, residual correlations and cross-loadings via modification index were avoided, a technique that often prevents the analysis from generalizing the factor structure. Also, no residual correlations and cross-loadings were used, which would support external validity. For this CFA step, the multivariate normality with kurtosis and skewness, multivariate outlier with Cook’s distance, and multicollinearity with variance inflation factors (VIFs) were checked. As summarized in Table 3 for the first sampling wave, kurtosis and skewness values ranged between − 2 and 2. All of VIFs were less than 5, which indicates multivariate normality without multicollinearity violations. In addition, all of Cook’s distances were less than 0.02, which is smaller than 1 and indicates there are no multivariate outliers in the dataset. Similarly, no evidence of a violation of multivariate normality, evidence of multivariate outliers, or multicollinearity at the other three time points was found.
Model evaluation and estimation
In CFA, the analysis applied ML estimates with Chi-square test of exact-fit hypothesis test using robust maximum likelihood (MLR) estimates, using the MLR option in Mplus (Muthén & Muthén, 1998–2015). Next, the analysis evaluated the hypothesized models using approximate fit indices including root mean square error of approximation (RMSEA), comparative fit index (CFI), and standardized root mean square residuals (SRMR) with the following criteria for good fit at RMSEA < 0.06, CFI > 0.95, and SRMR < 0.08 (Hu & Bentler, 1999) and adequate (or acceptable) fit at 0.08 > RMSEA > 0.05 (Browne & Cudeck, 1993) and 0.95 > CFI > 0.90 (Bentler, 1990).
Factor reliability
As a psychometric property of items indicating the degree to which factor scores are precise, the reliabilities of factors were examined using the factor rho reliability (\(\widehat{\rho }\); Raykov, 1997, 2004). The factor rho reliability is defined as a ratio of explained variance to total variance from CFA parameters:
where \(\sum\limits_{i} {\hat{\lambda }}\) is the sum of the estimated unstandardized factor loadings among indicators of the same factor, \(\hat{\phi }\) is the estimated factor variance, and \(\sum\limits_{i} {\hat{\theta }_{ii} }\) is the sum of the unstandardized error variances of those indicators. In CFA, factor loadings, error variances and error covariances are estimated, which influences true and total variance. Thus, to measure factor reliability within CFA model, factor reliability facilitating the CFA estimates is a preferred method to computing Cronbach’s alpha with unrefined composite scores for the scale (Brown, 2006).
Construct validity
While the validity of the items on the ATSI and subsequent mATSI have previously been evaluated in earlier studies, given our work to uncover underlying constructs based on factor loadings, we felt it was important to discuss construct validity with respect to convergent validity and discriminant validity in addition to showing that factor loadings are greater than 0.45 (Brown, 2006, 2015). These indexes of convergent and discriminant validities provide support for how the underlying constructs are measured accurately and separately from each other, respectively. As noted in Brown (2015), the CFA results provide evidence regarding how strongly indicators of a latent variable are interrelated (convergent validity) and how weakly latent variables are correlated (discriminant validity). Convergent validity was provided by obtaining factor reliabilities are greater than 0.70 (Nunnally & Bernstein, 1994) and discriminant validity was provided by obtaining factor correlations are lower than 0.80 (Brown, 2015).
Longitudinal measurement invariance
The test of measurement invariance evaluates the degree to which items have identical meaning across groups of test takers, and thus, provides validity evidence for scores on the measure as well as evidence of construct-irrelevant variance (e.g., group membership) (French & Finch, 2006). According to Schmitt and Kuljanin (2008), scores on a measure are invariant when test takers from different populations who are equivalent in terms of a measured construct produce the same observed score on the measure. On the other hand, a measure is not considered invariant when two people who are equivalent in terms of a measured construct are measured differently due to their different background and/or experience. When measurement invariance of a test does not hold, differences in observed scores can indicate true group mean differences and/or distinctions in the relationship between the construct and the observed score that is not identical across groups (Raju et al., 2002). Hence, the measurement process must seek to prevent irrelevant variables from influencing scores to avoid undesirable social consequences (Messick, 1989).
Multi-sample confirmatory factor analysis (MCFA) is a common method to test for measurement invariance, which allows researchers to assess the structure of a measure across groups or across time. This approach enables researchers to compare specific characteristics of the factor model across groups or across time (French & Finch, 2006). In our study, we analyzed the equalities of factor loadings (weak invariance), intercepts (strong invariance), and residuals (strict invariance) for the test of measurement invariance (Brown, 2006; Vandenberg & Lance, 2000). The steps of test for measurement invariance are further described below. In order to determine the consistency of the factor structures across four time points, measurement invariance was tested using Mplus (Muthén & Muthén, 1998–2015).
The procedures for analysis of measurement invariance included the following four items: (a) configural invariance, to test the invariance of the factor structure across groups; (b) weak invariance, to test the equality of factor loadings across groups; (c) strong invariance, to test the equality of indicator intercepts across groups, and (d) strict invariance, to test the equality of indicator error variances across groups. Same items as in four time points were correlated when we examined the measurement invariance. To confirm the level of invariance described below, the model comparison criterion suggested by Cheung and Rensvold (2002) was applied to retain invariance when the difference of CFI is less than 0.01. Although Little’s MCAR test indicated two items did not satisfy the missing completely at random mechanism (Rubin, 1976), all other 66 items over four time points did not violate the missing completely at random mechanism. Overall, missing data mechanism in this data is assumed as a missing at random (Rubin, 1976) based on the data collection procedure, and the missing data were handled by applying full information maximum likelihood estimate (Enders & Bandalos, 2001) in analyses.
Results
Exploratory factor analysis
EFA with 17 items (mATSI:1)
The analysis fit one-factor to seven-factor models into longitudinal data cross-sectionally during an exploratory analysis. Least square (LS)-type solution with Kaiser’s rule and parallel analysis yielded results that support a three-factor or two-factor model for Time 1 and a two-factor model for Time 2 to Time 4, whereas maximum likelihood (ML)-based solution provided evidence to support a six-factor model for Time 2 and five-factor model for the other time points. The large discrepancy between LS-type and ML-based estimation procedures seems due to redundancy of the 17 items and cross-loadings. For example, “Science is something I enjoy very much” and “Science is one of my favorite subjects” are highly correlated (r=0.76) at Time 1. In factor structure of factor loadings in Mplus output, “Science is something I enjoy very much” has loadings as 0.679, 0.598, − 0.547, 0.847, and − 0.358 in the five-factor model in Time 1. Although the high correlation and large cross-loadings do not directly indicate the item is problematic, the factor structure varying widely across time is misfit and thus, at least not plausible.
EFA with nine items (mATSI:2)
After investigating the redundancy and cross-loadings across the 17 items over four time points, the instrument was trimmed to nine items, and fit one-factor to three-factor models. For the purposes of clarity, the nine-item instrument is designated as mATSI:2. Both LS-type solution and ML-based solution provided evidence supporting a two-factor model whose item clusters both make logical and theoretical sense and are supported by the EFA results. Furthermore, the EFA results are consistent across the four time points, indicating a good fit as evidenced by the RMSEA, CFI, and SRMR fit indices. The first factor was named the value and enjoyment of science factor (VESF), and the second factor was named the science anxiety factor (SAF).
Confirmatory factor analysis
Model evaluation
The analysis fit two-factor model into each dataset over four semesters and obtain acceptable fit indexes such as \(0.064 \le RMSEA \le 0.078,\,\) \(0.944 \le CFI \le 0.960,\) and \(0.046 \le SRMR \le 0.062\), which means that the hypothesized two-factor model in Fig. 1 was supported across time with good or acceptable fit indexes.
Factor reliability and validity
Factor reliabilities of the VESF were 0.847, 0.888, 0.890, and 0.891 where scale reliabilities of the SAF were 0.816, 0.857, 0.843, and 0.862 across four time points, respectively. These factor reliabilities also provided convergent validities with higher factor loadings on both factors that were greater than 0.771 across time. Factor correlations were − 0.385, − 0.403, − 0.300, and − 0.246 that are much lower than 0.80, which provides discriminant validities. Thus, construct validity was confirmed across time.
Longitudinal measurement invariance
To examine the longitudinal measurement invariance of two-factor model, the analysis fit configural, loading, strong, and strict invariance into the whole sample. Results in Table 4 demonstrate that the relationships hold up to strict factorial invariance (\(\mathrm{\Delta CFI}=0.008<0.01\) for the comparison with strong factorial invariance), meaning that the means and variances of all nine indicators were not statistically different over time. This outcome indicates that the attitude toward science measure captures the two longitudinal factors invariantly. The longitudinal two-factor model is depicted in Figs. 1 and 2.
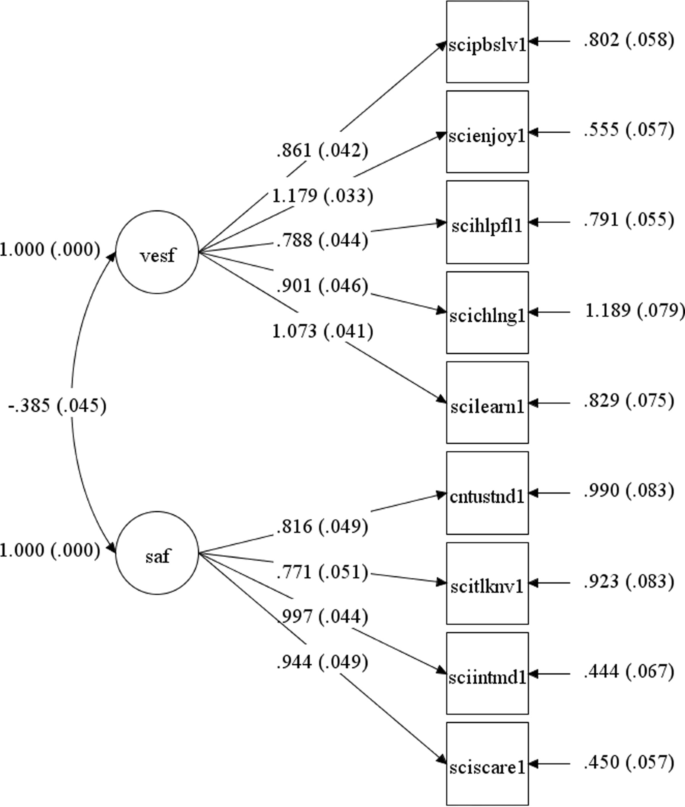
Two-factor model with one residual-correlation at Time 1 from CFA. Note. ‘vesf’ is the value and enjoyment of science factor and ‘saf’ is the science anxiety factor; ‘scipbslv1’ is the item “Science is useful in helping to solve the problems of everyday life”; ‘scienjoy1’ is the item “Science is something I enjoy very much”; ‘scihlpful1’ is the item “Science is helpful in understanding today’s world”; ‘scichlng1’ is the item “I like the challenge of science assignments”; ‘scilearn1’ is the item “I have a real desire to learn science”; ‘cntustnd1’ is the item “No matter how hard I try, I CANNOT understand science”; ‘scitlknv1’ is the item “I feel tense/nervous when someone talks to me about science”; ‘sciintmd1’ is the item “It makes me nervous to even think about doing science”; ‘sciscare1’ is the item “It scares me to have to take science at school”
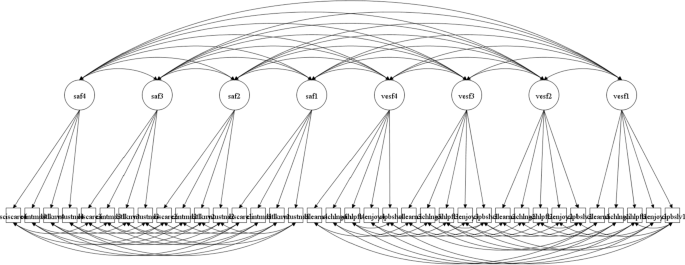
Longitudinal factor structure of science value and enjoyment factor and science anxiety factor. ‘vesf’ is the value and enjoyment of science factor and ‘saf’ is the science anxiety factor; the number after factor names denote time point, for example, ‘saf4’ means the SAF at time 4
The best-fitting model of attitudes toward science for the longitudinal data of 6th and 7th graders was a two-factor model. The model also holds the longitudinal strict invariance. The factor loadings and their standard errors are listed in Table 5. Factor correlations, variances, and latent means of two-factor model under the longitudinal strict invariance are further provided in Table 6.
Discussion
Due to the importance of establishing the unidimensionality of measured constructs of attitudes toward science (Gardner, 1974; Osborne et al., 2003), in this study a longitudinal and racially/ethnically diverse sample of 6th and 7th grade students was used to explore the factor structure of the mATSI:1 (Weinburgh & Steele, 2000) based on student responses to 17 items. EFA was used to establish a two-dimensional factor structure, rather than the previously suggested five constructs (Weinburgh & Steele, 2000) within the attitude toward science construct. In this study, a three-factor structure was also investigated, but upon inspection of the EFA results it did not seem that two of the three factors were distinct from one another. Through CFA, it was confirmed that the two-factor structure had the best fit to the longitudinal data (Table 5). The items included in each version of the mATSI are shown in Table 2.
Identification of the two underlying attitude toward science constructs was supported through both theoretical considerations and factor analysis results. Although the five attitudes toward science constructs as stated in the mATSI served as our a priori theoretical structure, the five-factor model was misfit. As Bandalos and Finney (2010) mentioned, “items are rarely aware of the scale for which they have been written and often fail to behave as they should” and thus, we were also not surprised to find support for a varying factor structure via EFA and CFA with a cross-validation. Although factor analysis was utilized to reduce the ATSI:a instrument to create the mATSI instrument, the underlying structure was not then re-examined as was done in this longitudinal study to investigate the factor structure of the mATSI. Furthermore, we used a reduced version (mATSI:1) of the mATSI, and examined the five constructs with a new sample of students. Finally, given that we expect identified subscales to vary based on the object the survey items refer to, and that there have been many identified subscales of attitudes toward science, we believe that the additional evidence and clarity through process of factor analysis is particularly valuable in this area.
A reduced factor structure also aligned with our conceptual and theoretical expectations when examining the survey items included on our survey. For instance, upon examination of the survey items, we were concerned that the “perception of the teacher” construct and some of the items under the “self-confidence in science” (i.e., “I usually understand what we are talking about in science”) and “desire to do science” (i.e., “Science is one of my favorite subjects”) might be informed too strongly with the student’s current experiences with his or her current science teacher and class. The results from the analysis indicated that the items within the ‘Self-confidence in science’ and ‘Desire to do science’ constructs that referred specifically to the students’ current science class did not conceptually align with the items that referred to science in general (“I have a real desire to learn science”) when considering that items within a construct should refer to attitudes about the same object. The wording of the ‘perception of the teacher’ items asks students about science teachers in general (i.e., “science teachers make science interesting”). Yet, the response may not be simple since students may have very different attitudes about different teachers that have taught them science. Also, we see attitudes as ‘relatively enduring’ (Koballa, 1988), and thus chose to focus on attitudes towards science as a more general pursuit, and less on the students’ particular science class experience at that time. In other words, based on our findings from this analysis, we recommend that a measure of attitudes toward school science should be considered separately from other attitude toward science constructs. We did not find strong theoretical support or empirical evidence for a unidimensional attitude towards school science construct within the survey items we investigated in this study.
Finally, the remaining items asking about students’ desire to do science, as well as the value student ascribe to science referred to science in general rather than students’ personal experience within a particular context. As such, we would expect these items to measure constructs more reflective of students’ enduring attitudes toward science, and thus aligns with our conceptual view of attitudes towards science. This distilled measure, in terms of both subscales and survey items, makes the mATSI:2 instrument more appropriate for use in measuring students’ attitude towards science in general. Researchers aiming to study more specific science subjects or contexts, such as students’ attitudes toward specific science teachers, the science curriculum within a specific school, or science subdisciplines, should consider other instruments with greater degrees of specificity.
Furthermore, the findings from this study support the longitudinal invariance of the investigated measures. The results showed that the two-factor structure was stable over time, and thus this instrument can be reliably used to measure the two identified constructs, “science anxiety” and “value and enjoyment of science” over time. This result is important considering the focus on changing attitudes toward science in the science education field.
The EFA analysis highlighted 13 items as relating to the “value and enjoyment of science” construct, and thus these items were inspected for redundancy (high correlation with other items within the construct) and cross-loading with other factors. In addition, two items were eliminated based on wording which suggested that the student responses may be highly dependent upon their feelings about their specific teacher at that time. These items did not align with our consideration of attitudes toward science as an enduring sentiment. For example, the item “My teacher makes science interesting” is much more relevant to the students’ relationship with his or her teacher at the time of the survey time than that students’ enduring sentiment about science. These items can still be evaluated in the future, as attitudes toward school science has been recognized as a distinct and important area of inquiry (Barmby et al., 2008), but were not considered to theoretically aligned with the other items correlating to the construct “value and enjoyment of science” within the supported two-factor structure.
The mATSI:2 version of the survey the advantage of a reduced time footprint as standalone survey as well as a via option to be included within a larger survey instrument. Robust results from EFA, CFA and measurement invariance analysis support a two-factor structure of student responses for the nine-item mATSI:2 instrument. It is important to note that these results suggest two independent, rather than opposing factors within the same dimension. The factors have been identified as science anxiety and value and enjoyment of science within the attitudes-toward-science construct.
Conclusions
Student attitudes toward science have been well-studied for many decades, and have been connected to many important outcomes such as desire to pursue STEM coursework and careers (Potvin & Hasni, 2014) and scientific literacy (Osborne et al., 2003). Science attitudes have also been shown to correlate with background and contextual variables such as gender, instructional strategies, and age (Catsambis, 1995; Pell & Jarvis, 2001; Sorge, 2007). Thus, the study of science attitudes can potentially inform STEM education equity efforts through the investigation of how instructional strategies and environments may differentially impact science attitudes of subgroups of students. The decline of science attitudes as age increases, especially among females, is a documented and concerning trend, and one that requires longitudinal studies to monitor (Barmby et al., 2008; Osborne et al., 2003). Given these potential implications of attitudes toward science, the importance of properly validated attitude instruments appropriate for a given age group and population that can be used longitudinally is clear. The mATSI:2 instrument is particularly well-suited to large-scale longitudinal studies as it is short enough to include in a larger survey, and it has been evaluated for longitudinal invariance.
The mATSI:2 evaluates student engagement and attitudes toward science. Thus, from a practical and educational standpoint, our results suggest that student engagement in learning science when considered across these different dimensions might have practical implications for youth program development in informal educational settings as well as curriculum development in formal educational settings. For example, measuring these two factors, science anxiety and value and enjoyment of science, within individual informal and formal educational settings may provide educators the ability to strengthen these programs, thereby providing better opportunities for student engagement and attitudes toward science. When examined in large-scale or longitudinal studies, the two factors may contribute to widespread advances in science curriculum, education, and future research.
Further research to investigate why students respond differently to these two areas as well as investigating differences across ages, genders, races and ethnicities in expressed attitudes toward science in regards to these two factors is both encouraged and planned. These analyses may be undertaken with confidence using this reduced instrument when considering the support of the EFA, CFA and measurement invariance analysis results presented in this study.
Limitations
While significant efforts were invested into validating the instrument, this study’s validity argument relies exclusively on statistical analysis of self-reported data. There were no other academic or attitudinal assessments included to test divergent/convergent validity and we were not able to interview or have focus groups carried out with students or educators in the sample provided. Finally, this study focuses students enrolled in 6th to 8th grade, and did not test for measurement invariance for gender and race/ethnicity, thereby limiting the generalizability of the measure. We chose the middle school age range as prior research suggests this is a time of transition and change in attitudes towards science, and also to expand upon the work of Gogolin and Swartz (1992) who sampled college students and Weinburgh and Steele (2000) who sampled 5th graders for their mATSI study. Since we found the instrument to be invariant across these grades we would expect it to also be invariant in earlier elementary grades and high school grades, but this must be tested in further research efforts involving research with these ages rather than assumed. Likewise, the investigation of invariance and reliability across gender and racial/ethnic subgroups is both necessary and planned in future research. In other words, this study focused on the underlying factor structure and longitudinal invariance of the modified mATSI:2, and while invariance longitudinally across a wider age range and gender and racial/ethnic groups is necessary and planned, it was beyond the scope of the current study. Furthermore, the instrument of interest was piloted and validated using a particular sample. Our sample varied from Weinburgh and Steele’s (2000) sample in ways such as racial/ethnic make-up, time of collection, and schools attended. Due to the uniqueness of the two samples we do not make any claims or comparisons between the two samples, but rather report results based on our sample.
Availability of data and materials
The datasets analyzed during the current study are not publicly available due to individual privacy compromised, but are available from the corresponding author on reasonable request.
Abbreviations
- ATSI:
-
Attitudes Toward Science Inventory
- CFA:
-
Confirmatory factor analysis
- CFI:
-
Comparative fit index
- EFA:
-
Exploratory factor analysis
- LS:
-
Least square
- mATSI:
-
Modified Attitudes Toward Science Inventory
- MCFA:
-
Multi-sample confirmatory factor analysis
- ML:
-
Maximum likelihood
- MLR:
-
Robust maximum likelihood
- RMSEA:
-
Root mean square error of approximation
- SAF:
-
Science anxiety factor
- SRMR:
-
Standardized root mean square residuals
- STEM:
-
Science, technology, engineering, and mathematics
- TOSRA:
-
Test of Science Related Attitudes
- VESF:
-
Value and enjoyment of science factor
- VIFs:
-
Variance inflation factors
References
Akarsu, B., & Kariper, A. (2013). Upper secondary school pupils’ attitudes towards natural science. European Journal of Physics Education, 4(1), 78–87.
Bandalos, D. L., & Finney, S. J. (2010). Factor analysis: Exploratory and confirmatory. In G. R. Hancock & R. O. Mueller (Eds.), The reviewer’s guide to quantitative methods in the social sciences (pp. 93–114). Routledge.
Barmby, P., Kind, P. M., & Jones, K. (2008). Examining changing attitudes in secondary school science. International Journal of Science Education, 30(8), 1075–1093.
Bentler, P. M. (1990). Comparative fit indexes in structural models. Psychological Bulletin, 107, 238–246.
Brown, T. A. (2006). Confirmatory factor analysis for applied research. Guilford Press.
Brown, T. A. (2015). Confirmatory factor analysis for applied research (2nd ed.). Guilford Press.
Browne, M. W., & Cudeck, R. (1993). Alternative ways of assessing model fit. In K. A. Bollen & J. S. Long (Eds.), Testing structural equation models (pp. 136–162). Sage.
Buck, G., Cook, K., Quigley, C., Eastwood, J., & Lucas, Y. (2009). Profiles of Urban, Low SES, African American Girls’ attitudes toward science: A sequential explanatory mixed methods study. Journal of Mixed Methods Research, 3(4), 386–410.
Buck, G. A., Cook, K. L., Quigley, C. F., Prince, P., & Lucas, Y. (2014). Seeking to improve African American girls’ attitudes towards science. The Elementary School Journal, 114(3), 431–453.
Cartwright, T. J., & Atwood, J. (2014). Elementary pre-service teachers’ response-shift bias: Self-efficacy and attitudes toward science. International Journal of Science Education, 36(14), 2421–2437.
Catsambis, S. (1995). Gender, race, ethnicity, and science education in the middle grades. Journal of Research in Science Teaching, 32(3), 243–257.
Cheung, G. W., & Rensvold, R. B. (2002). Evaluating goodness-of-fit indexes for testing measurement invariance. Structural Equation Modeling, 9, 233–255. https://doi.org/10.1207/S15328007SEM0902_5
Enders, C. K., & Bandalos, D. L. (2001). The relative performance of full information maximum likelihood estimation for missing data in structural equation models. Structural Equation Modeling, 8(3), 430–457.
Fraser, B. L. (1978). Development of a test of science-related attitudes. Science Education, 62(4), 509–515.
French, B. F., & Finch, W. H. (2006). Confirmatory factor analytic procedures for the determination of measurement invariance. Structural Equation Modeling, 13(3), 378–402.
Gardner, P. L. (1974). Sex differences in achievement, attitudes, and personality of science students: A review. Research in Science Education, 4(1), 231–258.
Gardner, P. L. (1975). Attitudes to science. Studies in Science Education, 2, 1–41.
Gardner, P. L. (1995). Measuring attitudes to science: Unidimensionality and internal consistency revisited. Research in Science Education, 25(3), 283–289.
Gogolin, L., & Swartz, F. (1992). A quantitative and qualitative inquiry into the attitudes towards science of nonscience college students. Journal of Research in Science Teaching, 29(5), 487–504.
Haladyna, T., & Shaughnessy, J. (1982). Attitudes toward science: A quantitative synthesis. Science Education, 66(4), 547–563.
Horn, J. L. (1965). A rationale and test for the number of factors in factor analysis. Psychometrika, 30, 179–185.
Hu, L. T., & Bentler, P. M. (1999). Cutoff criteria for fit indexes in covariance structure analysis: Conventional criteria versus new alternatives. Structural Equation Modeling, 6(1), 1–55.
Humphreys, L. G., & Montanelli, R. G. (1975). An investigation of parallel analysis criterion for determining the number of common factors. Multivariate Behavioral Research, 10, 191–205.
Hussar, K., Schwartz, S., Boiselle, E., & Noam, G. G. (2008). Toward a systematic evidence-base for science in out-of-school time: The role of assessment (pp. 1–87). Noyce Foundation.
Junious, B. Y. (2016). Creating, Implementing, and Evaluating the Use of a Food Science and Technology 5E Based Curriculum Impact on Underrepresented Minority Youth Engagement in Science [Master’s Thesis. Virginia Polytechnic Institute and State University]. Virginia Tech Archive. https://vtechworks.lib.vt.edu/handle/10919/73044.
Khoo, S. T., West, S. G., Wu, W., & Kwok, O. M. (2006). Longitudinal methods. In M. Eid & E. Dienser (Eds.), Handbook of multimethod measurement in psychology (pp. 301–317). American Psychological Association.
Kind, P., Jones, K., & Barmby, P. (2007). Developing attitudes towards science measures. International Journal of Science, 29(7), 871–893.
Koballa, T. R. (1988). Attitude and related concepts in science education. Science Education, 72(2), 115–126.
Lacey, T. A., & Wright, B. (2009). Occupational employment projections to 2018. Monthly Labor Review, 132(11), 82–123.
Lamb, R. L., Annetta, L., Meldrum, J., & Vallett, D. (2012). Measuring science interest: Rasch validation of the science interest survey. International Journal of Science and Mathematics Education, 10(3), 643–668.
Lattin, J., Carroll, J. D., & Green, P. E. (2003). Analyzing multivariate data. Duxbury.
Lewin, A. Y., & Zhong, X. (2013). The evolving diaspora of talent: A perspective on trends and implications for sourcing science and engineering work. Journal of International Management, 19(1), 6–13.
Lumsden, J. (1961). The construction of unidimensional tests. Psychological Bulletin, 58(2), 122–131.
Maltese, A. V., & Tai, R. H. (2011). Pipeline persistence: Examining the association of educational experiences with earned degrees in STEM among U.S. students. Science Education, 95(5), 877–907.
Meredith, W., & Horn, J. (2001). The role of factorial invariance in modeling growth and change. In L. M. Collins & A. G. Sayer (Eds.), New methods for the analysis of change (pp. 203–240). American Psychological Association.
Messick, S. (1989). Validity. In R. L. Linn (Ed.), Educational measurement (3rd ed., pp. 13–103). Macmillan.
Millsap, R. E., & Cham, H. (2012). Investigating factorial invariance in longitudinal data. In B. Laursen, T. D. Little, & N. A. Card (Eds.), Handbook of developmental research Methods (pp. 109–127). Guilford.
Munby, H. (1997). Issues of validity in science attitude measurement. Journal of Research in Science Teaching, 20(2), 141–162.
Muthén, L. K. & Muthén, B. O. (1998–2015). Mplus User’s Guide, 7th Edn. Muthén & Muthén
Nunnally, J. C., & Bernstein, I. H. (1994). Psychometric theory (3rd ed.). McGraw-Hill.
Osborne, J., Simon, S., & Collins, S. (2003). Attitudes towards science: A review of the literature and its implications. International Journal of Science Education, 25(9), 1049–1079.
Pell, T., & Jarvis, T. (2001). Developing attitude to science scales for use with children from five to eleven years. International Journal of Science Education, 23(8), 847–862.
Potvin, P., & Hasni, A. (2014). Interest, motivation and attitude towards science and technology at K-12 levels: A systematic review of 12 years of educational research. Studies in Science Education, 50(1), 85–129.
Raju, N. S., Laffitte, L. J., & Byrne, B. M. (2002). Measurement equivalence: A comparison of methods based on confirmatory factor analysis and item response theory. Journal of Applied Psychology, 87(3), 517–529.
Raykov, T. (1997). Estimation of composite reliability for congeneric measure. Applied Psychological Measurement, 22, 173–184. https://doi.org/10.1177/01466216970212006
Raykov, T. (2004). Behavioral scale reliability and measurement invariance evaluation using latent variable modeling. Behavior Therapy, 35, 299–331. https://doi.org/10.1016/S0005-7894(04)80041-8
Rennie, L. J., & Punch, K. F. (1991). The relationship between affect and achievement in science. Journal of Research in Science Teaching, 28(2), 193–209.
Romine, W., Sadler, T., Presley, M., & Klosterman, M. (2014). Student interest in technology and science (SITS) survey: Development, validation, and use of a new instrument. International Journal of Science and Mathematics Education, 12(2), 261–283.
Rubin, D. B. (1976). Inference and missing data. Biometrika, 63(3), 581–592.
Sadler, P. M., Sonnert, G., Hazari, Z., & Tai, R. (2012). Stability and volatility of STEM career interest in high school: A gender study. Science Education, 96(3), 411–427.
Satorra, A., & Bentler, P. M. (2010). Ensuring positiveness of the scaled difference chi-square test statistic. Psychometrika, 75, 243–248.
Schmitt, N., & Kuljanin, G. (2008). Measurement invariance: Review of practice and implications. Human Resource Management Review, 18(4), 210–222.
Shrigley, R. L. (1990). Attitude and behavior are correlates. Journal of Research in Science Teaching, 27(2), 97–113.
Simpson, R. D., & Oliver, J. S. (1990). A summary of major influences on attitude toward and achievement in science among adolescent students. Science Education, 74(1), 1–18.
Sorge, C. (2007). What happens? Relationship of age and gender with science attitudes from elementary to middle school. Science Educator, 16(2), 33–37.
Tai, R. H., Liu, C. Q., Maltese, A. V., & Fan, X. (2006). Planning early for careers in science. Science, 312, 1143–1144.
Unfried, A., Faber, M., Stanhope, D. S., & Wiebe, E. (2015). The development and validation of a measure of student attitudes toward science, technology, engineering, and math (S-STEM). Journal of Psychoeducational Assessment, 33(7), 622–639.
Vandenberg, R. J., & Lance, C. (2000). A review and synthesis of the measurement invariance literature: Suggestions, practices, and recommendations for organizational research. Organizational Research Methods, 3(1), 4–69.
Villafañe, S. M., & Lewis, J. E. (2016). Exploring a measure of science attitude for different groups of students enrolled in introductory college chemistry. Chemistry Education Research and Practice, 17, 731–742.
Wang, X. (2013). Why students choose STEM majors: Motivation, high school learning, and postsecondary context of support. American Educational Research Journal, 50(5), 1081–1121.
Weinburgh, M. H. (2003). The effects of systemic reform on urban, African American fifth grade students attitudes toward science. Journal of Women and Minorities in Science and Engineering, 9(1), 53–72.
Weinburgh, M. H., & Steele, D. (2000). The modified attitudes toward science inventory: Developing an instrument to be used with fifth grade urban students. Journal of Women and Minorities in Science and Engineering, 6, 87–94.
Acknowledgements
Not applicable.
Funding
This research was supported by the Yonsei University Research Grant of 2020 (2020-22-0069).
Author information
Authors and Affiliations
Contributions
RT contributed to the conception and design of the study, led data collection, and interpretation, and wrote and revised the manuscript. JR contributed to the conception and design of the study, led analysis and interpretation, and wrote and revised the manuscript. AS contributed to literature review and interpretation and wrote and revised the manuscript. KD contributed to interpretation and revised the manuscript. JA and AM contributed to design of the study and data collection. All authors read and approved the final manuscript.
Corresponding author
Ethics declarations
Ethics approval and consent to participate
This study was approved by the Institutional Review Board at the University of Virginia. Informed consent was received from all parents and informed assent was received from all youth participants included in this manuscript.
Competing interests
The authors have no financial or other conflicts of interest involved in this study.
Additional information
Publisher's Note
Springer Nature remains neutral with regard to jurisdictional claims in published maps and institutional affiliations.
Rights and permissions
Open Access This article is licensed under a Creative Commons Attribution 4.0 International License, which permits use, sharing, adaptation, distribution and reproduction in any medium or format, as long as you give appropriate credit to the original author(s) and the source, provide a link to the Creative Commons licence, and indicate if changes were made. The images or other third party material in this article are included in the article's Creative Commons licence, unless indicated otherwise in a credit line to the material. If material is not included in the article's Creative Commons licence and your intended use is not permitted by statutory regulation or exceeds the permitted use, you will need to obtain permission directly from the copyright holder. To view a copy of this licence, visit http://creativecommons.org/licenses/by/4.0/.
About this article

Cite this article
Tai, R.H., Ryoo, J.H., Skeeles-Worley, A. et al. (Re-)Designing a measure of student’s attitudes toward science: a longitudinal psychometric approach. IJ STEM Ed 9, 12 (2022). https://doi.org/10.1186/s40594-022-00332-4
Received:
Accepted:
Published:
DOI: https://doi.org/10.1186/s40594-022-00332-4